 Imagine you’re planning to meet with your supplier for a yearly evaluation. You want to review their defect rate over the last 12 months. But you don’t know where to find the data. It would take hours to sift through the dozens of inspection reports collected throughout the year and manually count each defect.
Now imagine you need to gather that data for multiple suppliers or multiple product types. Sounds tedious, right?
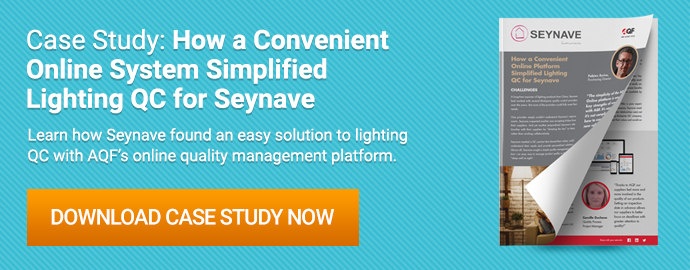
But the right online quality management system can relieve you of this time-consuming process and give you access to these data anytime. Asia Quality Focus (AQF) developed AQF Online to solve this problem and others (related: How a Convenient Online Quality Management System Simplified Lighting QC for Seynave [case study]).
AQF Online offers you the kinds of KPIs that help you understand how each vendor or factory is performing. At a glance, you’ll see which SKUs may need more oversight than others and what quality defects you may need to address directly. AQF Online can even help you manage your QC budget by comparing service volumes with results over time.
Curious what these KPIs and others might look like in your own personal, online dashboard? Let’s dive in and see what 10 KPIs you can start tracking in AQF Online today to meet your QC goals tomorrow.
Inspection result KPIs
As we saw in the above example, understanding your product quality over time can be difficult without a reliable way to collect and analyze the relevant metrics.
Many professional inspection firms offer detailed reporting complete with measurement data, on-site testing results, photos and more. But only a digital platform that maintains and sorts these detailed inspection results can give you the kind of high-level assessment that leads to long-term, continuous improvement.
That’s where AQF Online’s inspection result KPIs can help.
1. Inspections organized by overall report result
Have you ever wanted to quickly gain a sense of which products, product types or suppliers are passing or failing inspection?
AQF Online can show you in real time. You can filter reporting results by date, factory or product type to compare “conformed” or “not conformed” rates of different shipments.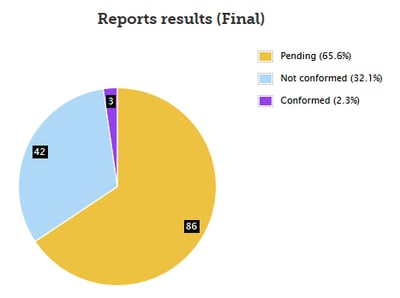
You can view results among multiple suppliers to get a general sense of supplier quality performance. Or you can compare a single supplier’s results from one time period to the next to see if their overall quality performance has improved or declined.
This metric can also help you maintain clear inspection requirements by reducing the number of “pending” results you receive over time. Pending results can occur when suspected non-conformances found during inspection weren’t included in the inspection checklist.
A high number of pending results might be a sign that you need to further clarify your requirements with your supplier or inspection team.
2. Specific inspection check results
Sometimes a basic view of overall inspection results is all you may need. But other times you may want a similar view of what types of issues are leading to these overall inspection results.
AQF inspection reports sort specific checks into distinct categories for easy review. Like the overall result, these are classified as “conformed”, “not conformed” or “pending”.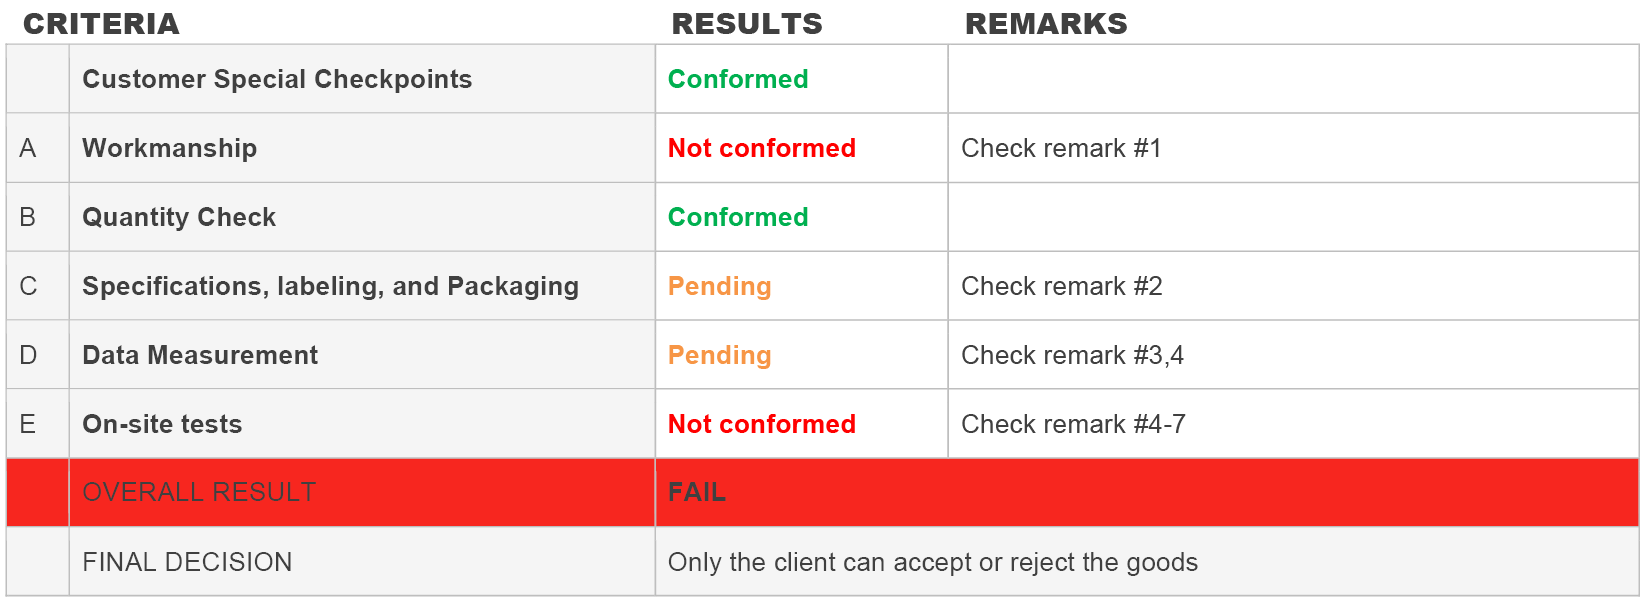
AQF’s online quality management system can give you conformance data for these specific results across multiple inspections, segmenting them by:
- Workmanship: Total defects found compared to the number of allowed defects per AQL sampling
- Order quantities: Quantity of finished and packed goods available for inspection on site in comparison to your overall order quantity
- Packaging and product specifications: Checks to verify shipping marks, inner and outer packaging, packaging assortment, bar codes, logos and color assortment
- Data measurements: Size and weight measurements of the product and packaging
- On-site tests: Results for any on-site performance, function and safety tests
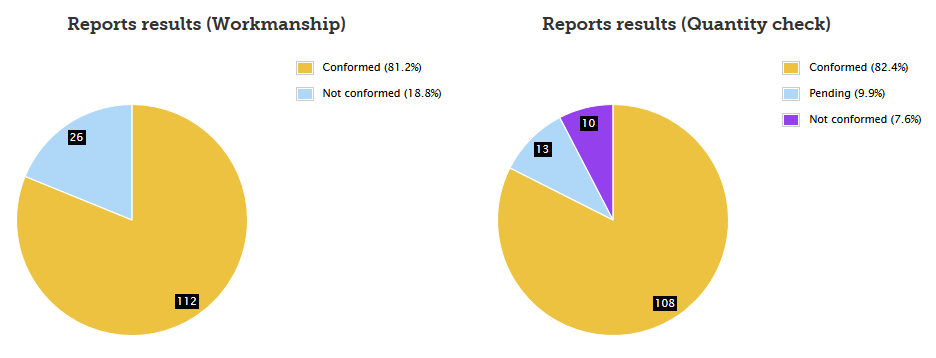 You can see a visual breakdown of these specific results by percentage of conformed, not conformed and pending. You can then determine from these results whether you need to adjust product specifications or address specific issues with your suppliers.
If the quantity check category has a high rate of not-conforming results, for instance, you might need to push your supplier to meet production deadlines. Or if a supplier repeatedly fails data measurement checks, then you might need to emphasize your product or packaging dimensions with your supplier.
Reviewing these metrics helps you meet your quality targets by showing you which vendor or product lines may need improvements or adjustments.
Product defect tracking data
How often have you wanted to track individual product defects that may be recurring or especially problematic?
Pinpointing specific defects and diagnosing their causes can be one of the hardest steps in the quality improvement process. And a top-level view of overall results, or even of specific checks, often isn’t enough.
Having a granular view of the different types of individual defects found in your products is a vital prerequisite to effectively addressing them. AQF Online gives you this transparency with a few different metrics you can view on your dashboard.
3. Defects by AQL classification
AQF classifies quality defects following acceptable quality limit (AQL) 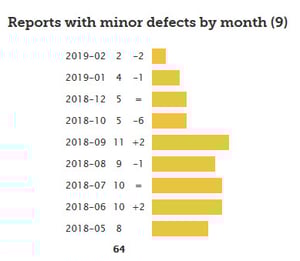 standards in both inspection reports and our online quality management system. These AQL defect data help you track the severity of defects present in your orders. Defects are categorized in three types in this way:
You can view the number of each kind of defect found in your orders per month, as well as a comparison with the number found during the prior month.
4. Defects by factory or vendor
If you’ve ever wanted a look at the raw number or percentage of quality defects found at each factory or with each vendor, AQF Online can help with that, too.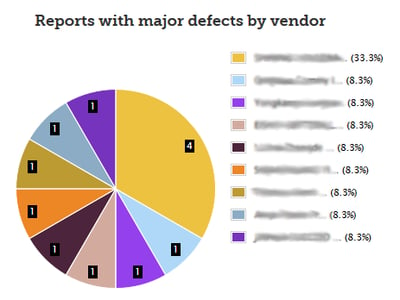
This kind of data can be powerful in helping you develop or evaluate suppliers. You’ll be able to identify which suppliers have the highest rate of reports with critical, major or minor defects. With these data in hand, you can meet with suppliers and discuss how to better collaborate to prevent future quality issues.
In contrast, discovering which vendor has the lowest defect rates can also give you confidence to develop a long-term relationship with them.
5. Defects by quality issue
Grouping defects by quality issue can show you which specific production processes may be to blame. That’s why you might find defects by quality issue to be an important KPI to measure.
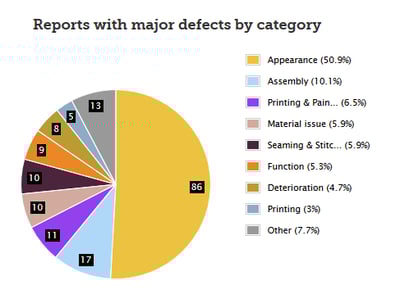 How AQF Online categorizes defects by quality issue can vary according to your product type, but these categories generally include:
The same category might refer to different quality issues in different products as well. If a power bank is not charging a mobile phone properly, the related defect would be categorized as a “function” issue.
But if you import reclining chairs, a function defect would more likely refer to an issue with the chair’s reclining mechanism or other furniture-specific functions.
How AQF’s online quality management system can help you identify recurring quality defects
Tracking defects based on their severity and types is essential to determining what issues most commonly occur in your products. You can then prioritize the more serious issues and take action to prevent them.
You can also export the defect data from AQF Online to manipulate offline or share it with your team more easily. The defect report, exported in spreadsheet format, will include:
- Mission number
- Mission date
- Factory/vendor name
- Product name
- AQL defect classification
- Quality issue category
- Detailed defect description
You can spot any new specific defects by monitoring the defect tracking data over time. Or you can track issues you’re already aware of and verify whether your supplier has taken steps to limit these issues over time.
Further action might include clarifying specifications through a QC checklist, especially when you haven’t communicated instructions clearly enough beforehand.
Or there may be defects found during an inspection that turn out to be acceptable after all. In this case, adjusting your tolerances to match your requirements can ensure improved reporting accuracy going forward.
Service volume KPIs
When was the last time you had a clear idea of how many inspections you arranged at each facility in your supply chain over a period longer than one month? Or how many man days you’ve needed to inspect different SKUs?
If you’re like many importers, calculating these figures on the fly is difficult. In fact, even larger importers, especially those with more frequent shipments and higher order quantities, struggle to corral massive amounts of service volume data to gain meaningful insight.
AQF Online tracks and displays all our service volume data for you. With easy access to this reporting in your dashboard, you can adjust your inspection volumes as needed to meet your quality targets and QC budget.
6. Man days by month
You can quickly estimate your quality control costs by knowing the total number of man days used.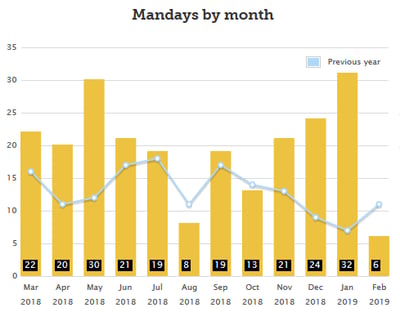
The data can also help you assess your QC needs throughout the year and prepare for peak seasons. Inspection companies are often busy in the few weeks and months leading up to Chinese New Year, for instance. Reviewing this KPI can help you assess your service volume during these peak seasons and ensure inspector availability for your orders.
AQF Online provides a comparison of each month’s man-day count compared to the previous month’s. A table also shows the month’s man-day count as a percentage of the year’s total.
7. Missions by vendor or factory
Missions by vendor or factory tell you how many services were performed at each facility over time.
This metric is particularly helpful for importers juggling multiple suppliers or vendors. This metric helps you evaluate the impact of inspections on the quality of the goods you receive from each factory.
For instance, maybe you infrequently conduct pre-shipment inspections at one supplier’s facility, and you’re receiving orders with many quality issues. 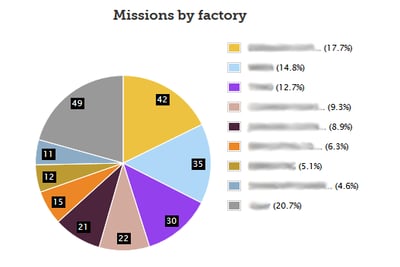 You might need to expand the inspection scope or frequency to catch these issues before shipment.
Or maybe you regularly inspect shipments at another factory, and the goods have consistently met your requirements over the past year. You might try cutting the number of inspections at this facility if you feel less oversight is needed.
You can also filter all the available KPIs in AQF Online by vendor or factory, so you can home in on each individual supplier.
8. Missions by service type
QC inspections can provide different insights and value to your business when performed at different stages of production. Many importers rely on pre-shipment inspections alone to manage product quality.
But if you find unacceptable quality issues that take a long time to rework, or can’t easily be reworked at all, you may want to consider inspecting earlier in your production schedule. 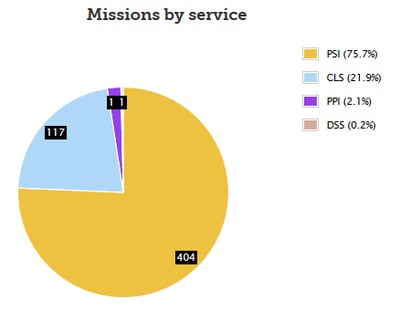
Missions by service type is a KPI that classifies your inspections by the different stages, with the number and percentage of each inspection type conducted.
Inspection services will generally be categorized by:
- Pre-production inspection (PPI)
- During production inspection (DPI)
- Pre-shipment inspection (PSI)
- Container loading supervision (CLS)
- Defect sorting service (DSS)
- Production monitoring (PM)
This KPI can help you assess where in the production schedule you’re currently inspecting and how you might better manage your QC budget to proactively identify quality issues (related: How Experienced Importers Limit Product Defects in 3 Stages [eBook]).
9. Missions by geographic location
When importing from different regions or countries, lesser-developed regions sometimes require more inspections to keep production on track than more mature sourcing destinations.
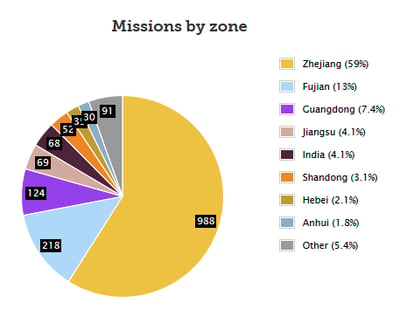 Missions by geographic location, or “zone”, is a metric in AQF Online showing the number of missions performed in each manufacturing country. Your dashboard can also show missions by province for mainland China.
This metric lets you easily compare regions where you have the most inspections with regions where you import the most. This can help you to weigh alternative sourcing destinations and their impact on your QC budget.
And all the KPIs in AQF Online are available for all the countries where AQF operates. That means you can get a consolidated look at all your inspection KPIs, rather than relying on different inspection companies in different countries, each with varying data.
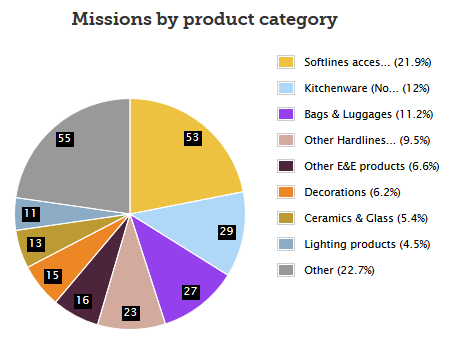
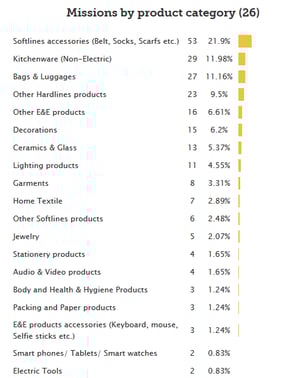
10. Missions by product category
Managing product quality for a range of product types can be challenging. Often, you must maintain separate suppliers, product specifications, QC checklists and defect tolerances for each product type.
AQF Online makes it easy to measure KPIs between multiple product types by sorting your mission data by product category.
You can sort your metrics by over 45 separate product types. Or you can sort more generally by softlines, hardlines, toys or electronics and electrical categories. You can even search by product name if you want to focus on one individual SKU.
How AQF can help you adjust your service volumes to meet your budget
All these service volume metrics can help you manage your inspection budget and ensure you’re maximizing the value of our QC solutions.
How much are you spending on different vendors? Specific products? You can compare AQF’s KPIs with your overall sales performance and profit margins to determine if you should be spending more or less on oversight of a particular facility or product category.
And AQF can collaborate with you further to help you meet your budget requirements by adjusting your inspection volume or scope where needed (related: How AQF Balances Your QC Inspection Needs with Your Budget).
Conclusion
Quality management tools can be empowering when planning your company’s quality control strategy. By analyzing each KPI, you’ll gain a clearer understanding of what actions you can take to improve product quality.
Some other QC companies only provide reports in PDF or Word format. Asia Quality Focus can give you detailed analysis and long-term data through our online quality management system, AQF Online.
And from there, AQF can help you find the most suitable inspection scope and methods to achieve your quality targets based on your inspection results and priorities. As an extension of your company, we’ll be by your side closely examining your KPIs and working with you to help you address recurrent quality issues.
Click the button below to find out how AQF’s online quality management system helped one importer simplify their QC processes!